Excel: Charts in Depth (2019)
This post was published 6 years ago. Download links are most likely obsolete. If that's the case, try asking the uploader to re-upload.

MP4 | Video: AVC, 1280x720 30 fps | Audio: AAC, 48 KHz, 2 Ch | Duration: 2h 36m
Skill Level: Intermediate | Genre: eLearning | Language: English + Sub | Size: 394 MB
Excel charts allow you to communicate information with much more impact than raw numbers and are surprisingly easy to generate. Instructor Dennis Taylor shows you how to create different kinds of Excel charts, from column, bar, line and pie to more recently introduced types like Treemap, Funnel, and Pareto. He explains what types of data work best with each so you can decide which type to choose for your specific information. Plus, learn how to fine-tune your chart's color and style; add titles, labels, and legends; insert shapes, pictures, and text boxes; and pull data from multiple sources.
Topics include
Chart essentials
Fine-tuning charts with design tab choices
Inserting pictures, shapes, and text boxes
Adding shape effects
Applying WordArt styles
Working with chart text
Changing the rotation of chart text
Changing a chart's data source
Printing and sharing charts
In-cell chart alternatives
Homepage
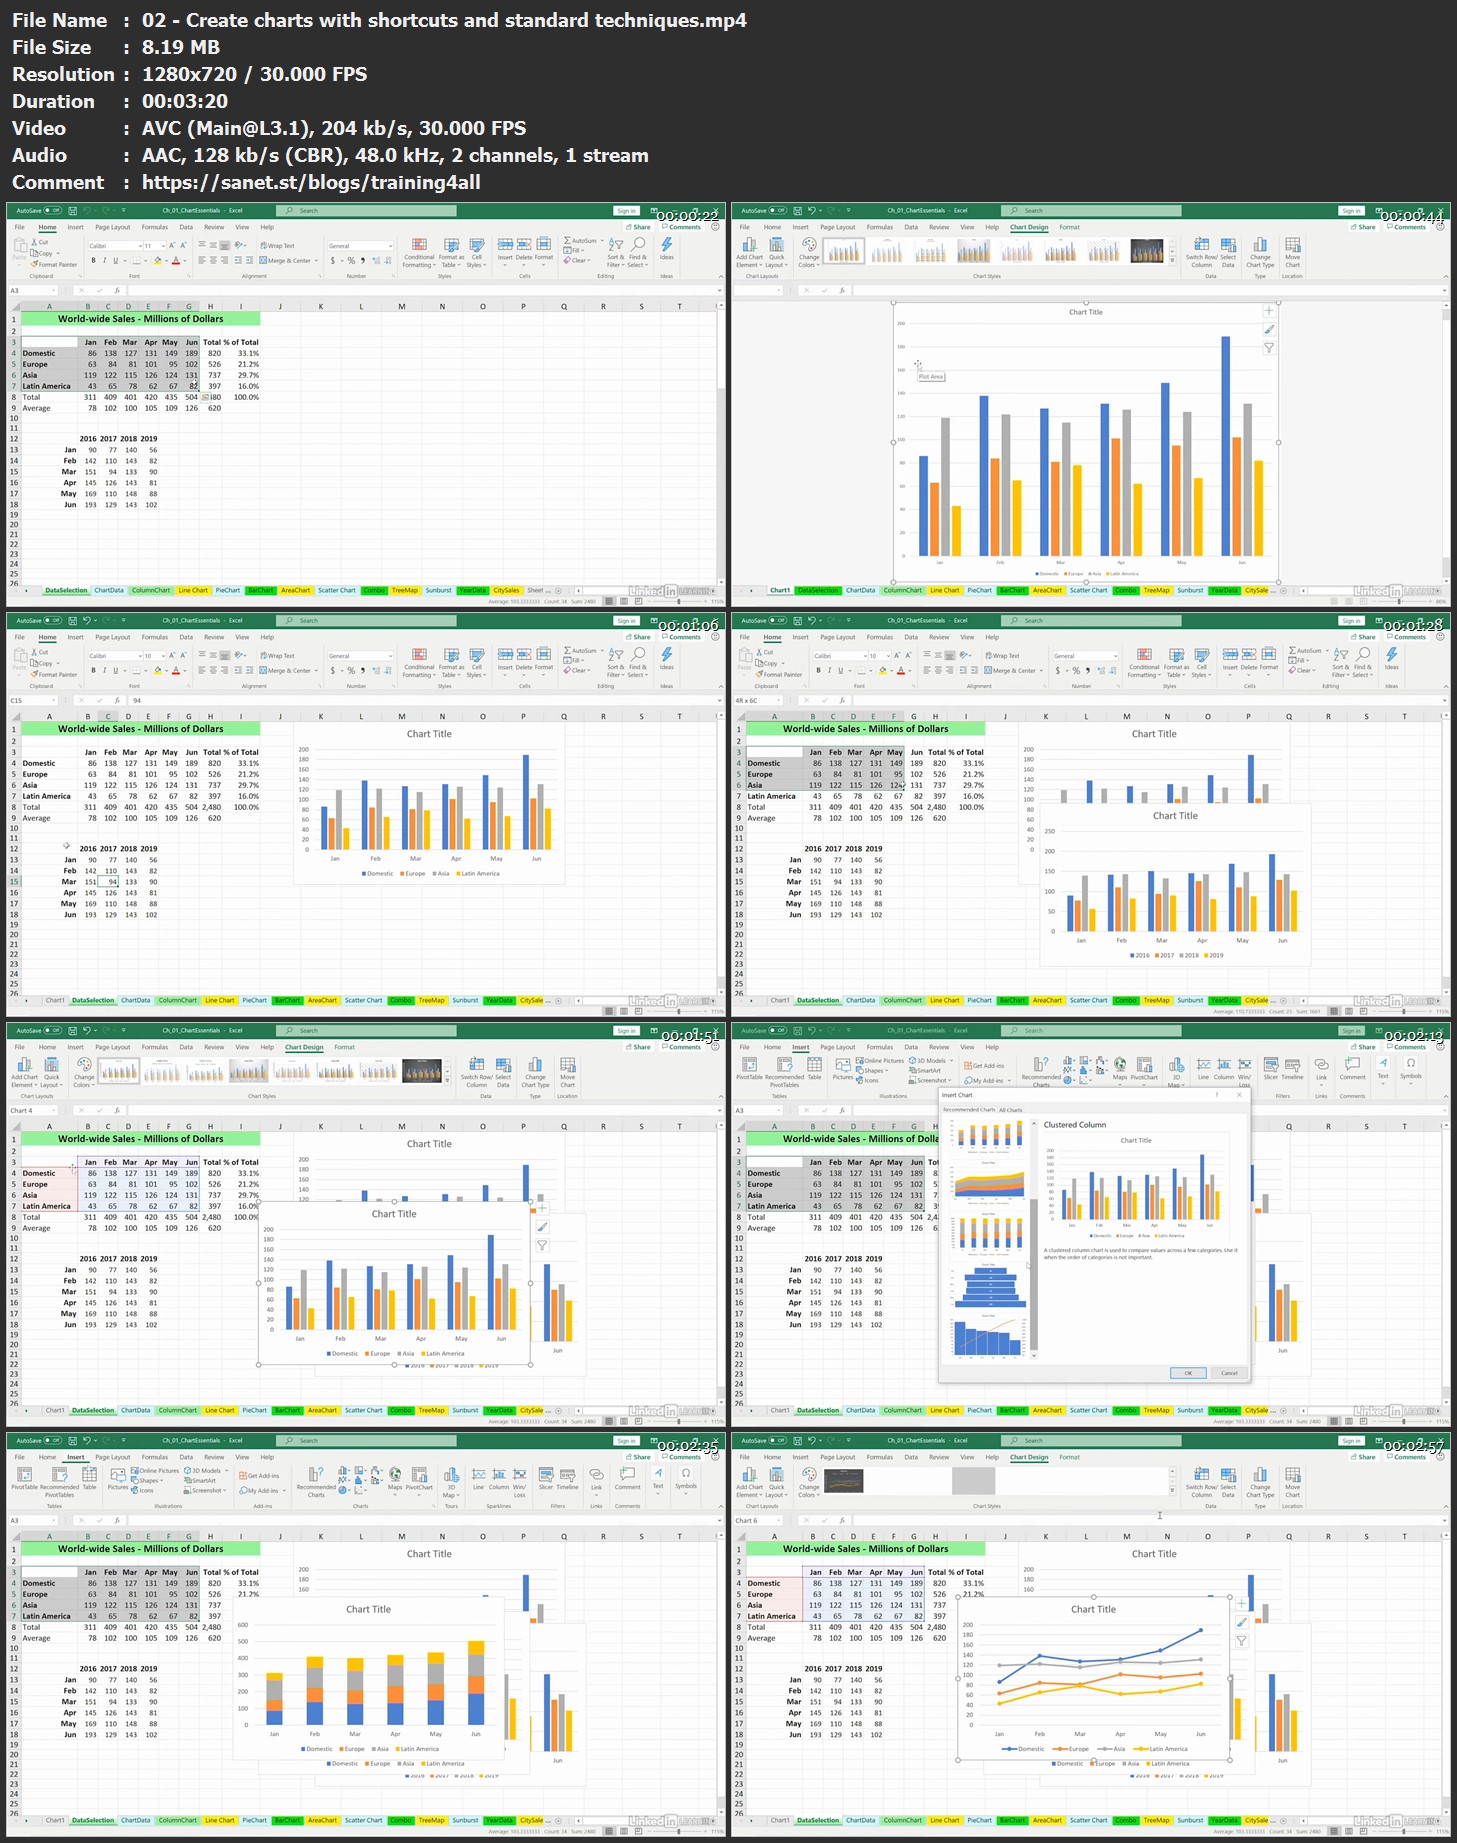
Screenshots
Bookmark my blog to get more stuff every day!
Newest course ==>> Training for all <<== Newest course
Latest OS ===>> Share for Progressive <<=== Latest OS
Huge book blog ====>> Books <<==== Huge book blog
Quick check before we show the links
Helps us keep automated scrapers from hammering the filehosts.